The complete management system for agribusiness
Equipmetry Agro brings fields, machinery, fuel, warehouse, grain floor and people together in one system. Every field has a single complete profile: crop, field map, every operation performed, cost per hectare, satellite condition and final yield. The farm is run on actual data, not on evening summaries.
The platform manages more than 80,000 hectares of farmland — from planting to the elevator
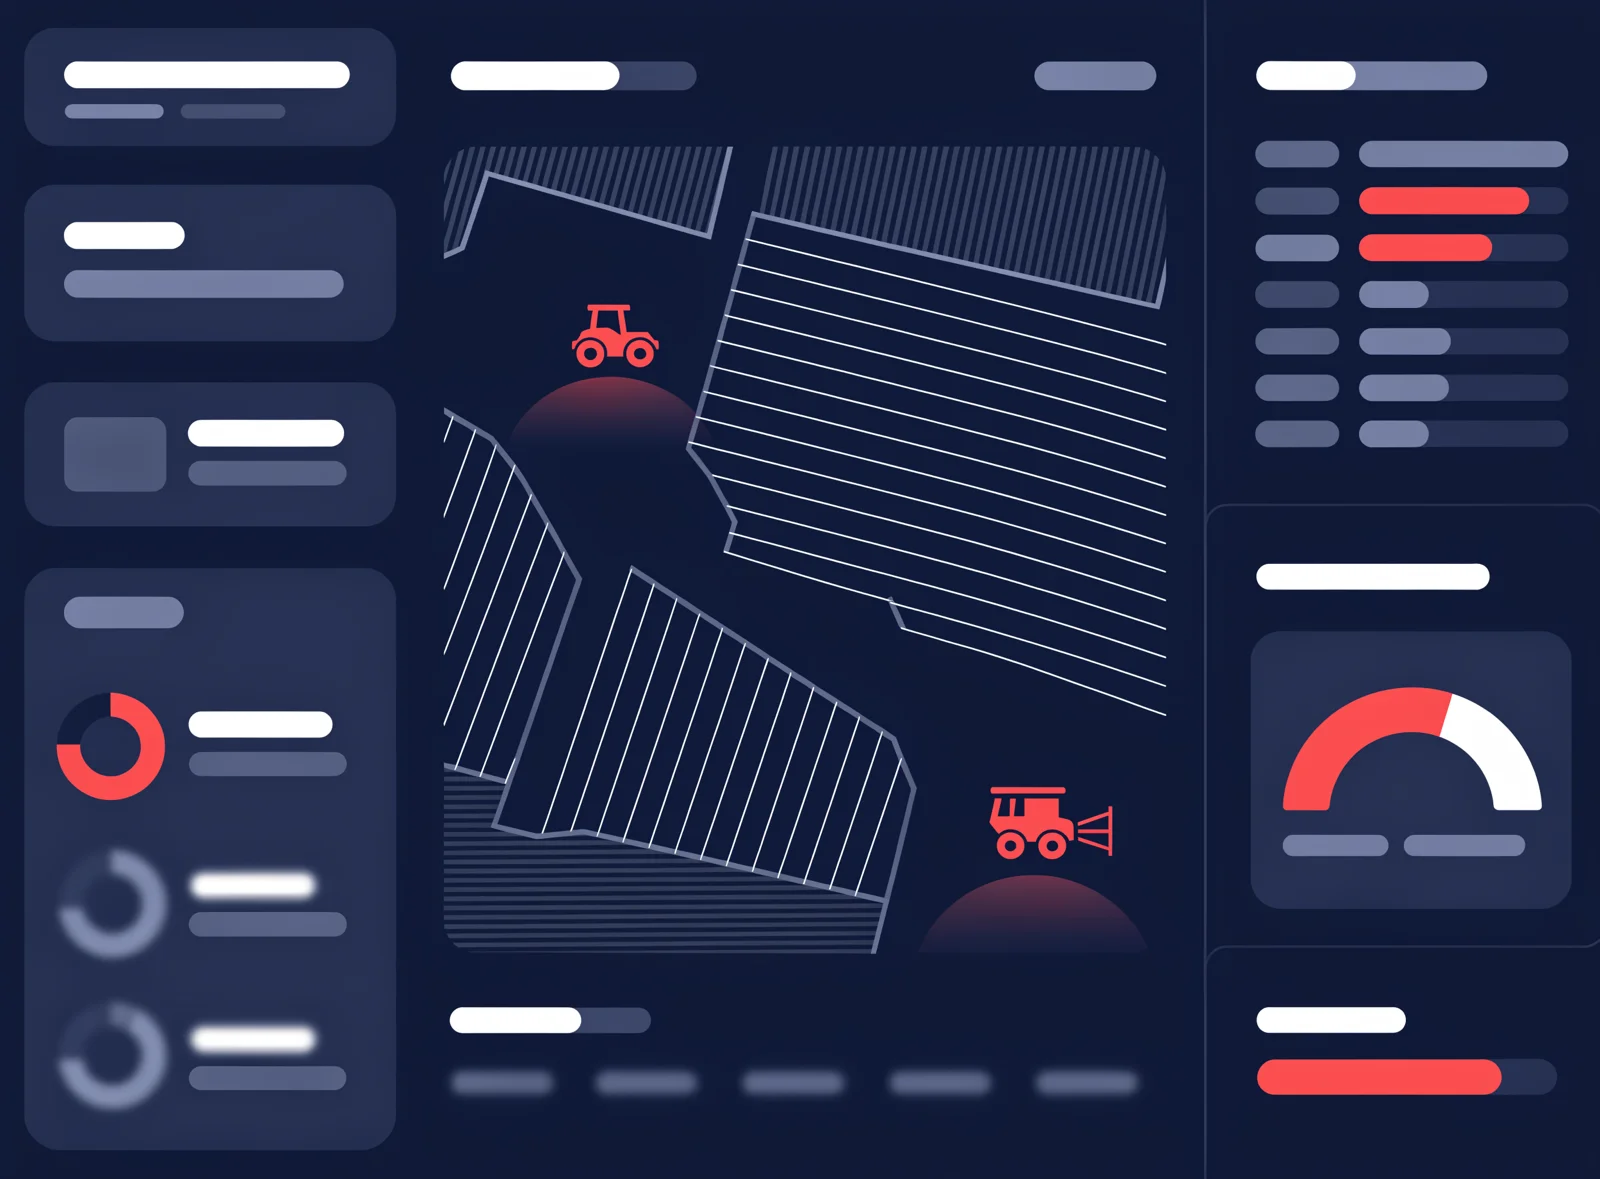
Field reports are perfect — right up until people compile them
A single growing season has dozens of places where a farm can lose money. It rarely loses a lot at once — it loses a little, continuously: fuel, hectares, application rates, seed and crop protection products, agro-timing.
Fuel is reliably burned less than the numbers claim — even with fuel-level sensors installed. Hectares get drawn wider than the actual field, and application rates exist only on paper, in the field map. Each leak is invisible on its own and always has an explanation — but together they eat into the thin per-hectare margin the whole business depends on.
Everyone knows what actually happened in the field.
The machine operator knows how much ground he really covered. —
The fueler knows where the fuel really went. —
The agronomist knows the treatment was applied with the wrong product, at the wrong time. —
The only person who doesn't know is the one paying for all of it.
You find out the yield once — in autumn, on the scales.
By then, everything that led to it can no longer be checked or fixed.
One field, one profile
Agro is built around the field. Everything that happens to it over the season flows into one profile, drawn from two categories of sources. Machine work and the field's own condition are the same data, shown from two sides. Field profiles roll up into the whole farm picture: where planting is underway, what's falling behind schedule, and what a hectare of each crop actually cost.
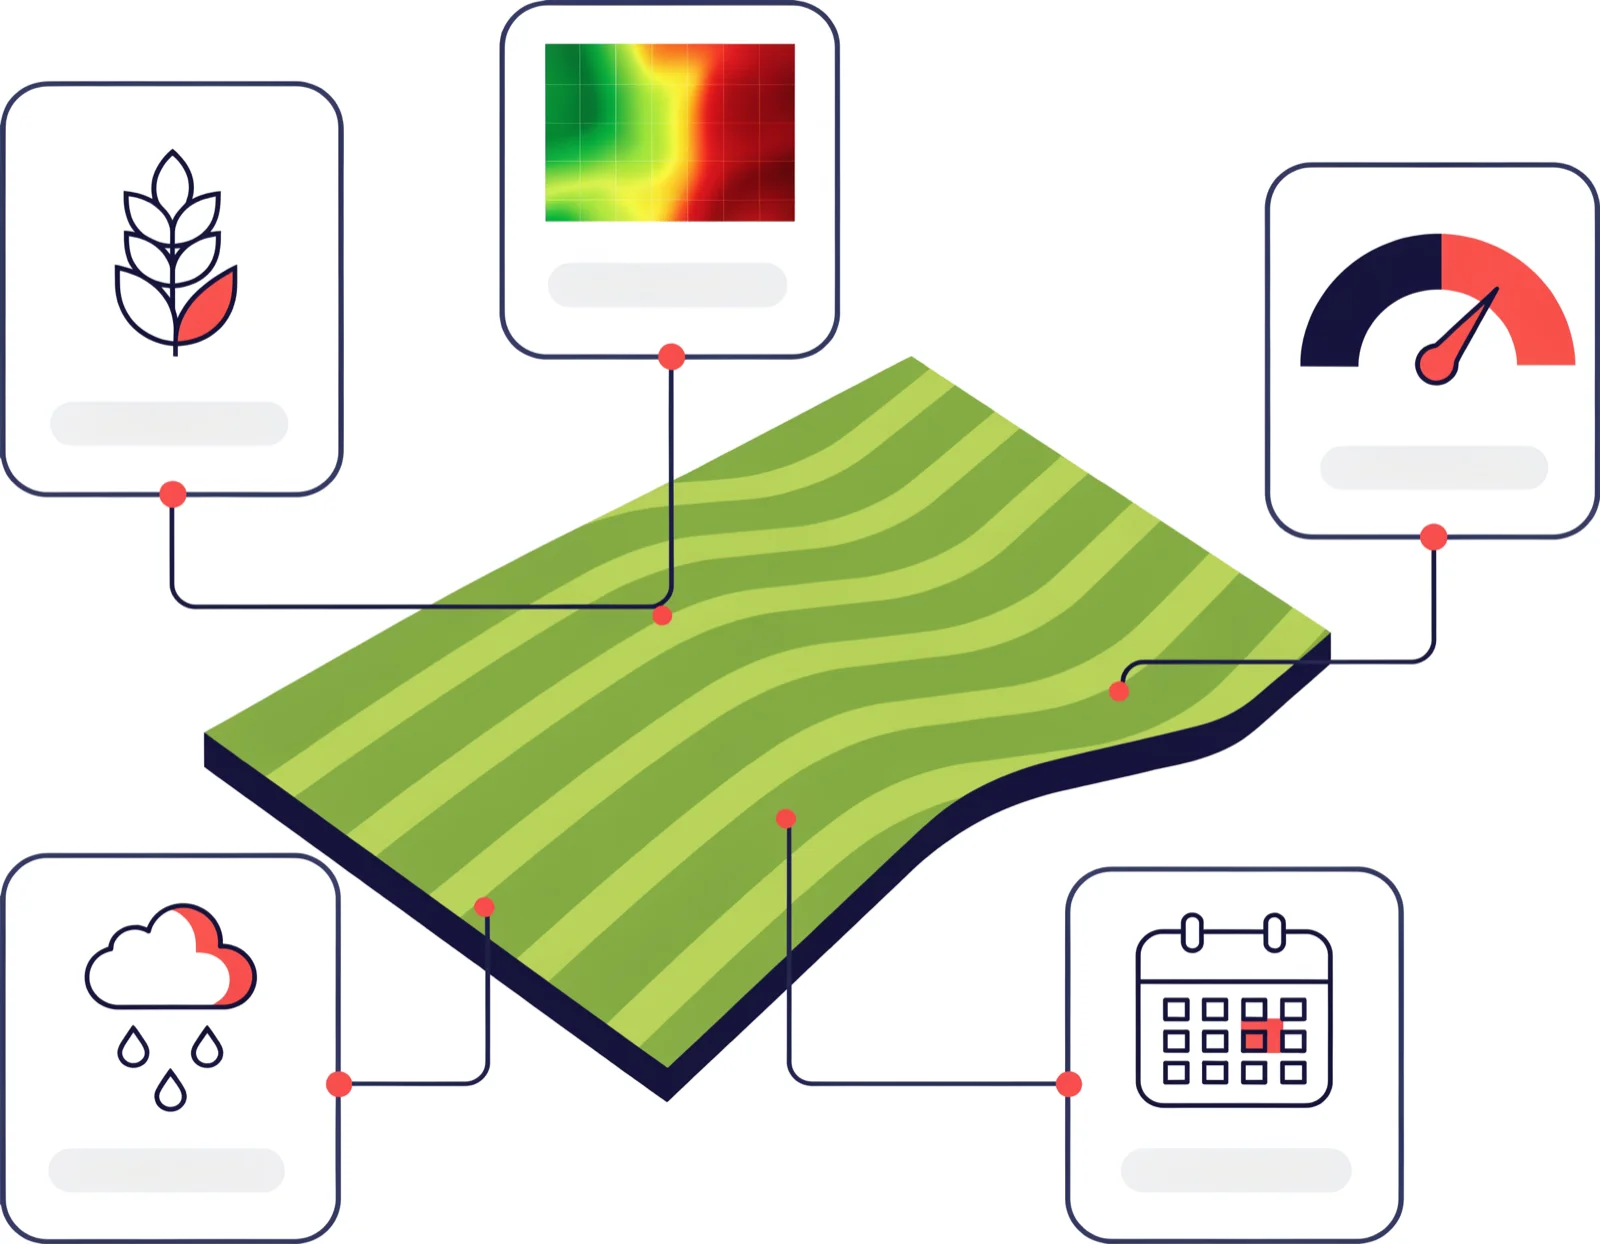
Where the facts come from
Sensors and telematics
GPS tracks, engine hours, fuel-level sensors. Hectares covered are counted by actual pass, consumption — by fuel-sensor readings. This data isn't entered by a person; it can't be padded or written off on someone's word.
This data isn't entered by a person; it can't be padded or written off on someone's wordSatellite and weather stations
Crop condition via vegetation indices, stress zones, unproductive patches and the real productive area — from satellite. Rainfall, leaf wetness and soil probes — from weather stations. This data also enters the system without any human involvement.
This data also enters the system without any human involvementSix loops, one farm
Each loop covers its own part of the season. They all run on the same data — the field profile and the machine profile — so they never contradict each other. At the bottom, everything comes together into tasks and analytics.
A digital field map with year-by-year history: crops, varieties, planting and harvest dates, field maps and agro-timing. You can see what's growing where, what's planned, and what's falling behind.
Every operation — from moisture closing to harvest — is logged via GPS track: area covered, overlaps, speed, rate compliance. Work is accepted based on fact, not on a verbal report.
Fuel is tracked along the whole path: tank farm → fuel truck → a specific machine's tank → write-off to a field and operation. Balances, refuelings, consumption norms. The system reconciles the balance and flags discrepancies.
Seed, crop protection products and fertilizer, tied to each operation. Balances, issue against a specific job, and write-offs based on application rates and hectares actually covered. You can see what really went to the field and what only exists on paper.
Weather stations across the farm: rainfall, leaf wetness, soil probes, wind and frost. The system shows windows for planting, treatments and harvest. A treatment is scheduled when its effect is greatest — not whenever there's time for it.
Vegetation indices for every field, stress zones, long-standing unproductive patches and usable area. A problem in the field becomes visible weeks before it's spotted from the road.
Tasks and people
Deviations turn into tasks with an owner and a deadline: a sensor that's gone silent, speeding during planting, an overdue treatment. The manager sees a list of what needs a decision — not a stream of raw data.
Analytics and reports
Cost per hectare by crop and field, machine output, fuel and inventory consumption, yield from hopper weight to elevator delivery. Not separate reports someone compiles by hand, but a cut of data that's already been verified at the point of entry.
AI that gets used every day
We spent a long time looking for where AI actually helps run a farm. The answer turned out to be with agronomists and farm managers. Three tools survived a full field season and made it into the product.
Farm assistant
A question is asked in plain language — right in Telegram or WhatsApp: what was planted on this field last year, how much fuel was burned on fallow, where the combines are right now. The answer is assembled from system data, with no digging through reports.
What changes in the numbers
The impact is made up of several line items, each calculated separately. Below are the most common results of the economic impact of using Equipmetry Agro, based on real growing seasons.
Working in Equipmetry Agro, you don't get reports on last season — you get control over the current one, while there's still time to act on it.
Integrations. Works with what you already have
Agro doesn't require you to replace your telematics or accounting system. Data comes from your existing sources, and documents flow into your accounting.
Telematics and GPS
Multiple providers can be connected at once if your fleet runs on different systems.
Satellite data
Weather stations
Accounting systems
Maps
Tracks, field boundaries, geofences for grain floors and warehouses.
Notifications and access
Login via corporate SSO.
Who runs on Agro
Full cycle: fields, machinery, fuel, weather, satellite monitoring — from planting to the elevator.
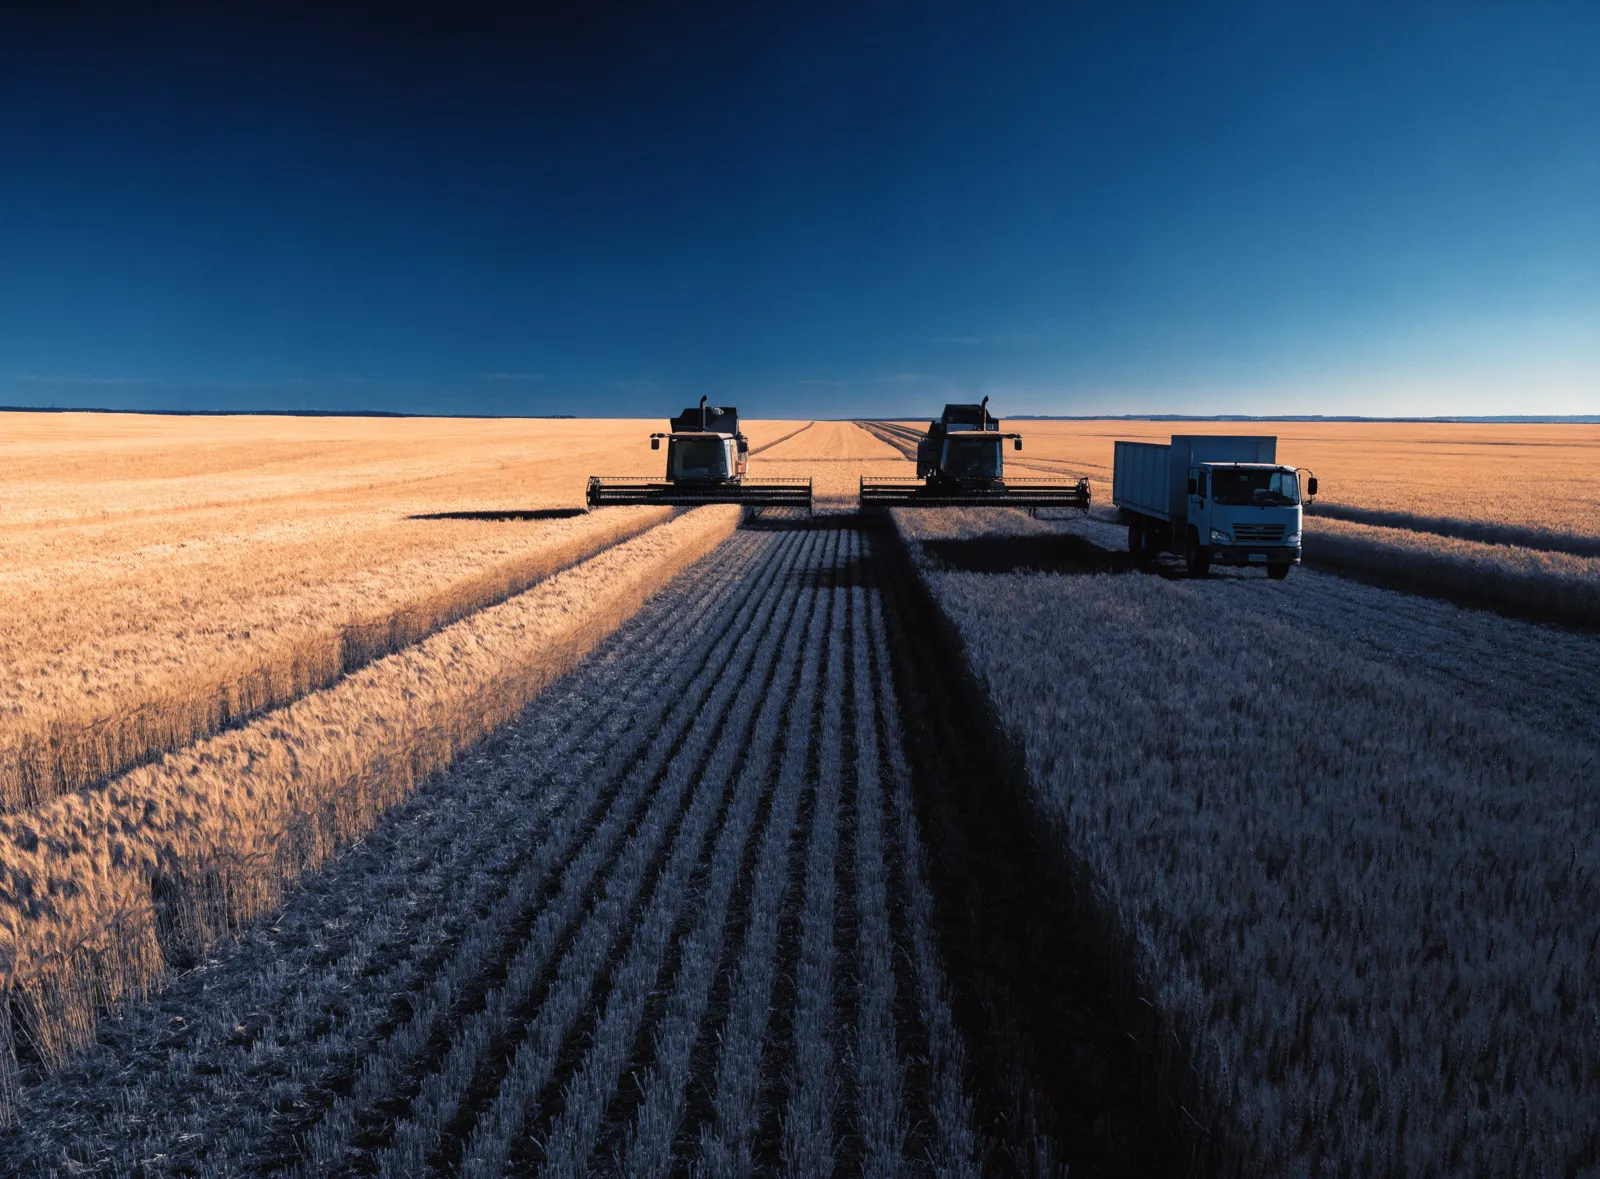
Along with other crop-farming operations — from single farms to holdings
How the rollout works
Rollout follows six steps across three phases.
First, a survey of the farm and its processes; then configuration to match your field maps and telematics integration; then go-live with on-site training and ongoing support.
See Agro in action
Get in touch and tell us about your farm. We'll discuss how we can help and show you the system live, on data from a real season.